
A calculation doing the rounds says a ₹1 crore corpus can fund 30 years of retirement and still grow to ₹3.37 crore. The assumptions are 8% a year, a first-year withdrawal of ₹3.5 lakh rising 5% annually for inflation.
We reproduced it. It is exactly right.
It is also one of the most fragile numbers in personal finance, and the fragility is the part worth your attention.
What the headline calculation says
| Year | Opening | Withdrawal | Closing |
|---|---|---|---|
| 1 | ₹1.00 Cr | ₹3.50 L | ₹1.04 Cr |
| 10 | ₹1.48 Cr | ₹5.43 L | ₹1.54 Cr |
| 20 | ₹2.23 Cr | ₹8.84 L | ₹2.32 Cr |
| 30 | ₹3.25 Cr | ₹14.41 L | ₹3.37 Cr |
The logic is simple. You withdraw 3.5% in year one. The portfolio earns 8%. The gap compounds, so the corpus grows even as you spend from it, and thirty years later there is more than three times what you started with.
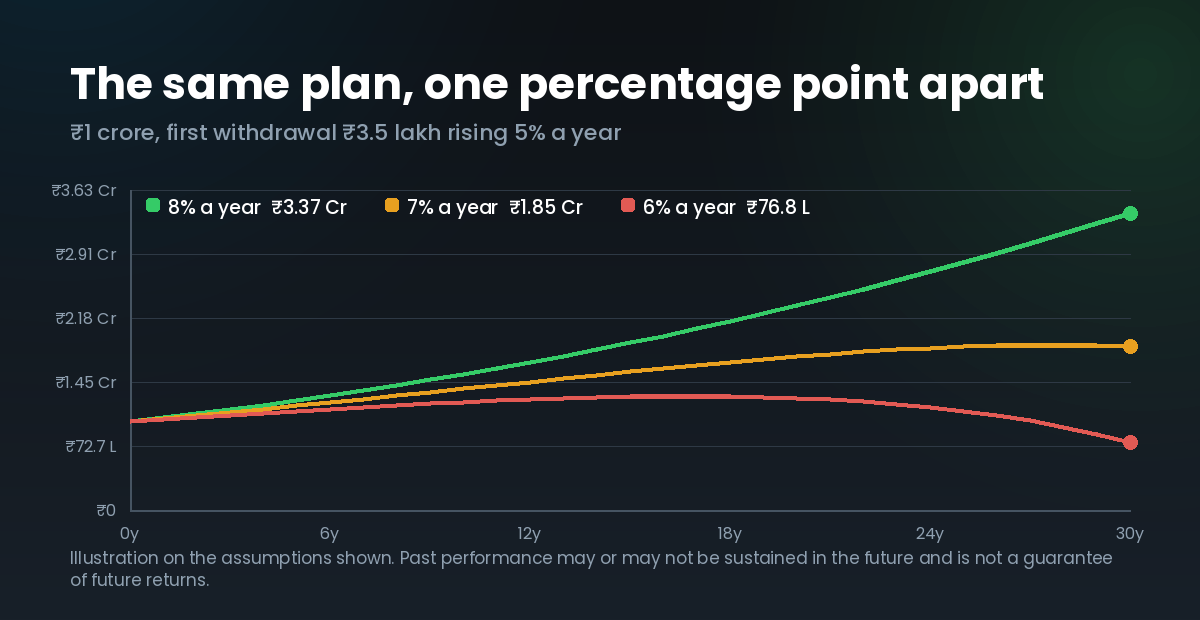
Illustration on the assumptions stated. Past performance may or may not be sustained in the future and is not a guarantee of future returns.
Now change one number
Hold everything constant and vary only the return:
| Assumed return | Corpus after 30 years |
|---|---|
| 8% | ₹3.37 crore |
| 7% | ₹1.85 crore |
| 6% | ₹0.77 crore |
One percentage point costs you ₹1.5 crore. Two percentage points and the corpus has shrunk over thirty years despite starting at a whole crore.
Now hold the return at 8% and vary the withdrawal instead:
| First-year withdrawal | Outcome |
|---|---|
| ₹3.5 lakh (3.5%) | ₹3.37 crore left |
| ₹5.0 lakh (5%) | ₹0.49 crore left |
| ₹6.0 lakh (6%) | Runs out in year 25 |
₹6 lakh a year is ₹50,000 a month. That is not an extravagant retirement in an Indian city in 2026. And on these assumptions it exhausts a crore with five years still to go — at which point you are 85 and have no portfolio.
Why this matters more than it looks
Every one of those rows is the same headline calculation with one input nudged. None of the changes is unreasonable. Yet the outcomes range from "wealthy heirs" to "destitute at 85".
That is the actual finding, and it is the opposite of reassuring. The widely shared version presents a single number as though it were a fact about retirement. It is a fact about one set of assumptions, and the assumptions are doing all the work.
The assumption most likely to be wrong
Not the return. The inflation escalation.
The calculation raises withdrawals 5% a year. General inflation may well run near that. But retiree spending is not general spending — it is weighted towards healthcare, and healthcare inflation in India has run persistently above headline inflation for years.
A retiree's real escalation is therefore often higher than 5%, and it accelerates in the later years when medical needs rise — precisely when the corpus is least able to absorb it. The model assumes a smooth 5% for thirty years. Real life delivers a flat decade and then a bad one.
Sequence risk: the thing no table shows
Every calculation of this kind assumes a steady 8% every year. Markets do not deliver steady anything.
Consider two retirees with identical corpora and identical average returns over thirty years. One gets poor returns in the first five years, good ones later. The other gets the reverse.
They do not end up in the same place — not remotely. The first retiree is selling units at depressed prices in the early years to fund withdrawals, permanently reducing the base that everything after compounds on. The second is drawing from a portfolio that grew first.
This is sequence-of-returns risk, and it is the single largest danger in retirement that a spreadsheet with one average return cannot show you. The average is identical. The outcome is not.
It is also why a retirement portfolio is not simply an accumulation portfolio held longer. During accumulation, a fall is an opportunity — your SIP buys more units. During withdrawal, the same fall is damage, because you are selling into it.
What this implies in practice
- Treat 3–3.5% as the starting point, not 5%. The famous 4% rule came from US data over a specific period, and Indian inflation, longevity and asset behaviour all differ. Starting lower is the cheapest protection available.
- Hold two to three years of spending outside equity. This is the direct defence against sequence risk: in a bad year you draw from the stable bucket instead of selling equity into a fall. It costs you some return in good years. That is the premium on the insurance.
- Recalculate annually, not once. A retirement plan set at 60 and never revisited is a forecast, and forecasts about thirty years are worthless. Reviewing the withdrawal each year against what actually happened is what converts it into a plan.
- Be willing to cut in a bad year. Retirees who reduce withdrawals by 10% after a poor year dramatically improve their odds. Rigid withdrawals are what exhaust corpora.
- Do not assume a fixed 8% while holding 100% equity. Equity does not deliver 8% smoothly, and a retiree cannot wait out a five-year drawdown while withdrawing from it.
Run it on your own numbers
Our SWP calculator does exactly this arithmetic with your corpus, your withdrawal and your assumed return. It is worth doing twice: once with the assumptions you hope for, and once with one percentage point removed.
The second number is the one to plan around. If the plan only works at 8%, it is not a plan — it is a hope with a spreadsheet attached.
The point
₹1 crore can last thirty years. It can also run out in twenty-five. Both statements are true and the difference between them is about ₹2 lakh a year of spending, or one percentage point of return.
Anyone who gives you a single confident number for this has left out the only part that matters. Ask what happens if the return is one point lower — and if they have not worked that out, they have not worked it out.